Cost, forecast and anomalies
Daily cost by service and account, a month-end forecast, and anomalies flagged when spend leaves its normal range.
Online version, always current: https://cloudvision360.com/docs/cloudvision360/cost-and-forecast/
CloudVision360 brings cloud cost into the same place as security and identity, so cost and risk decisions are made together.
Cost you can explain
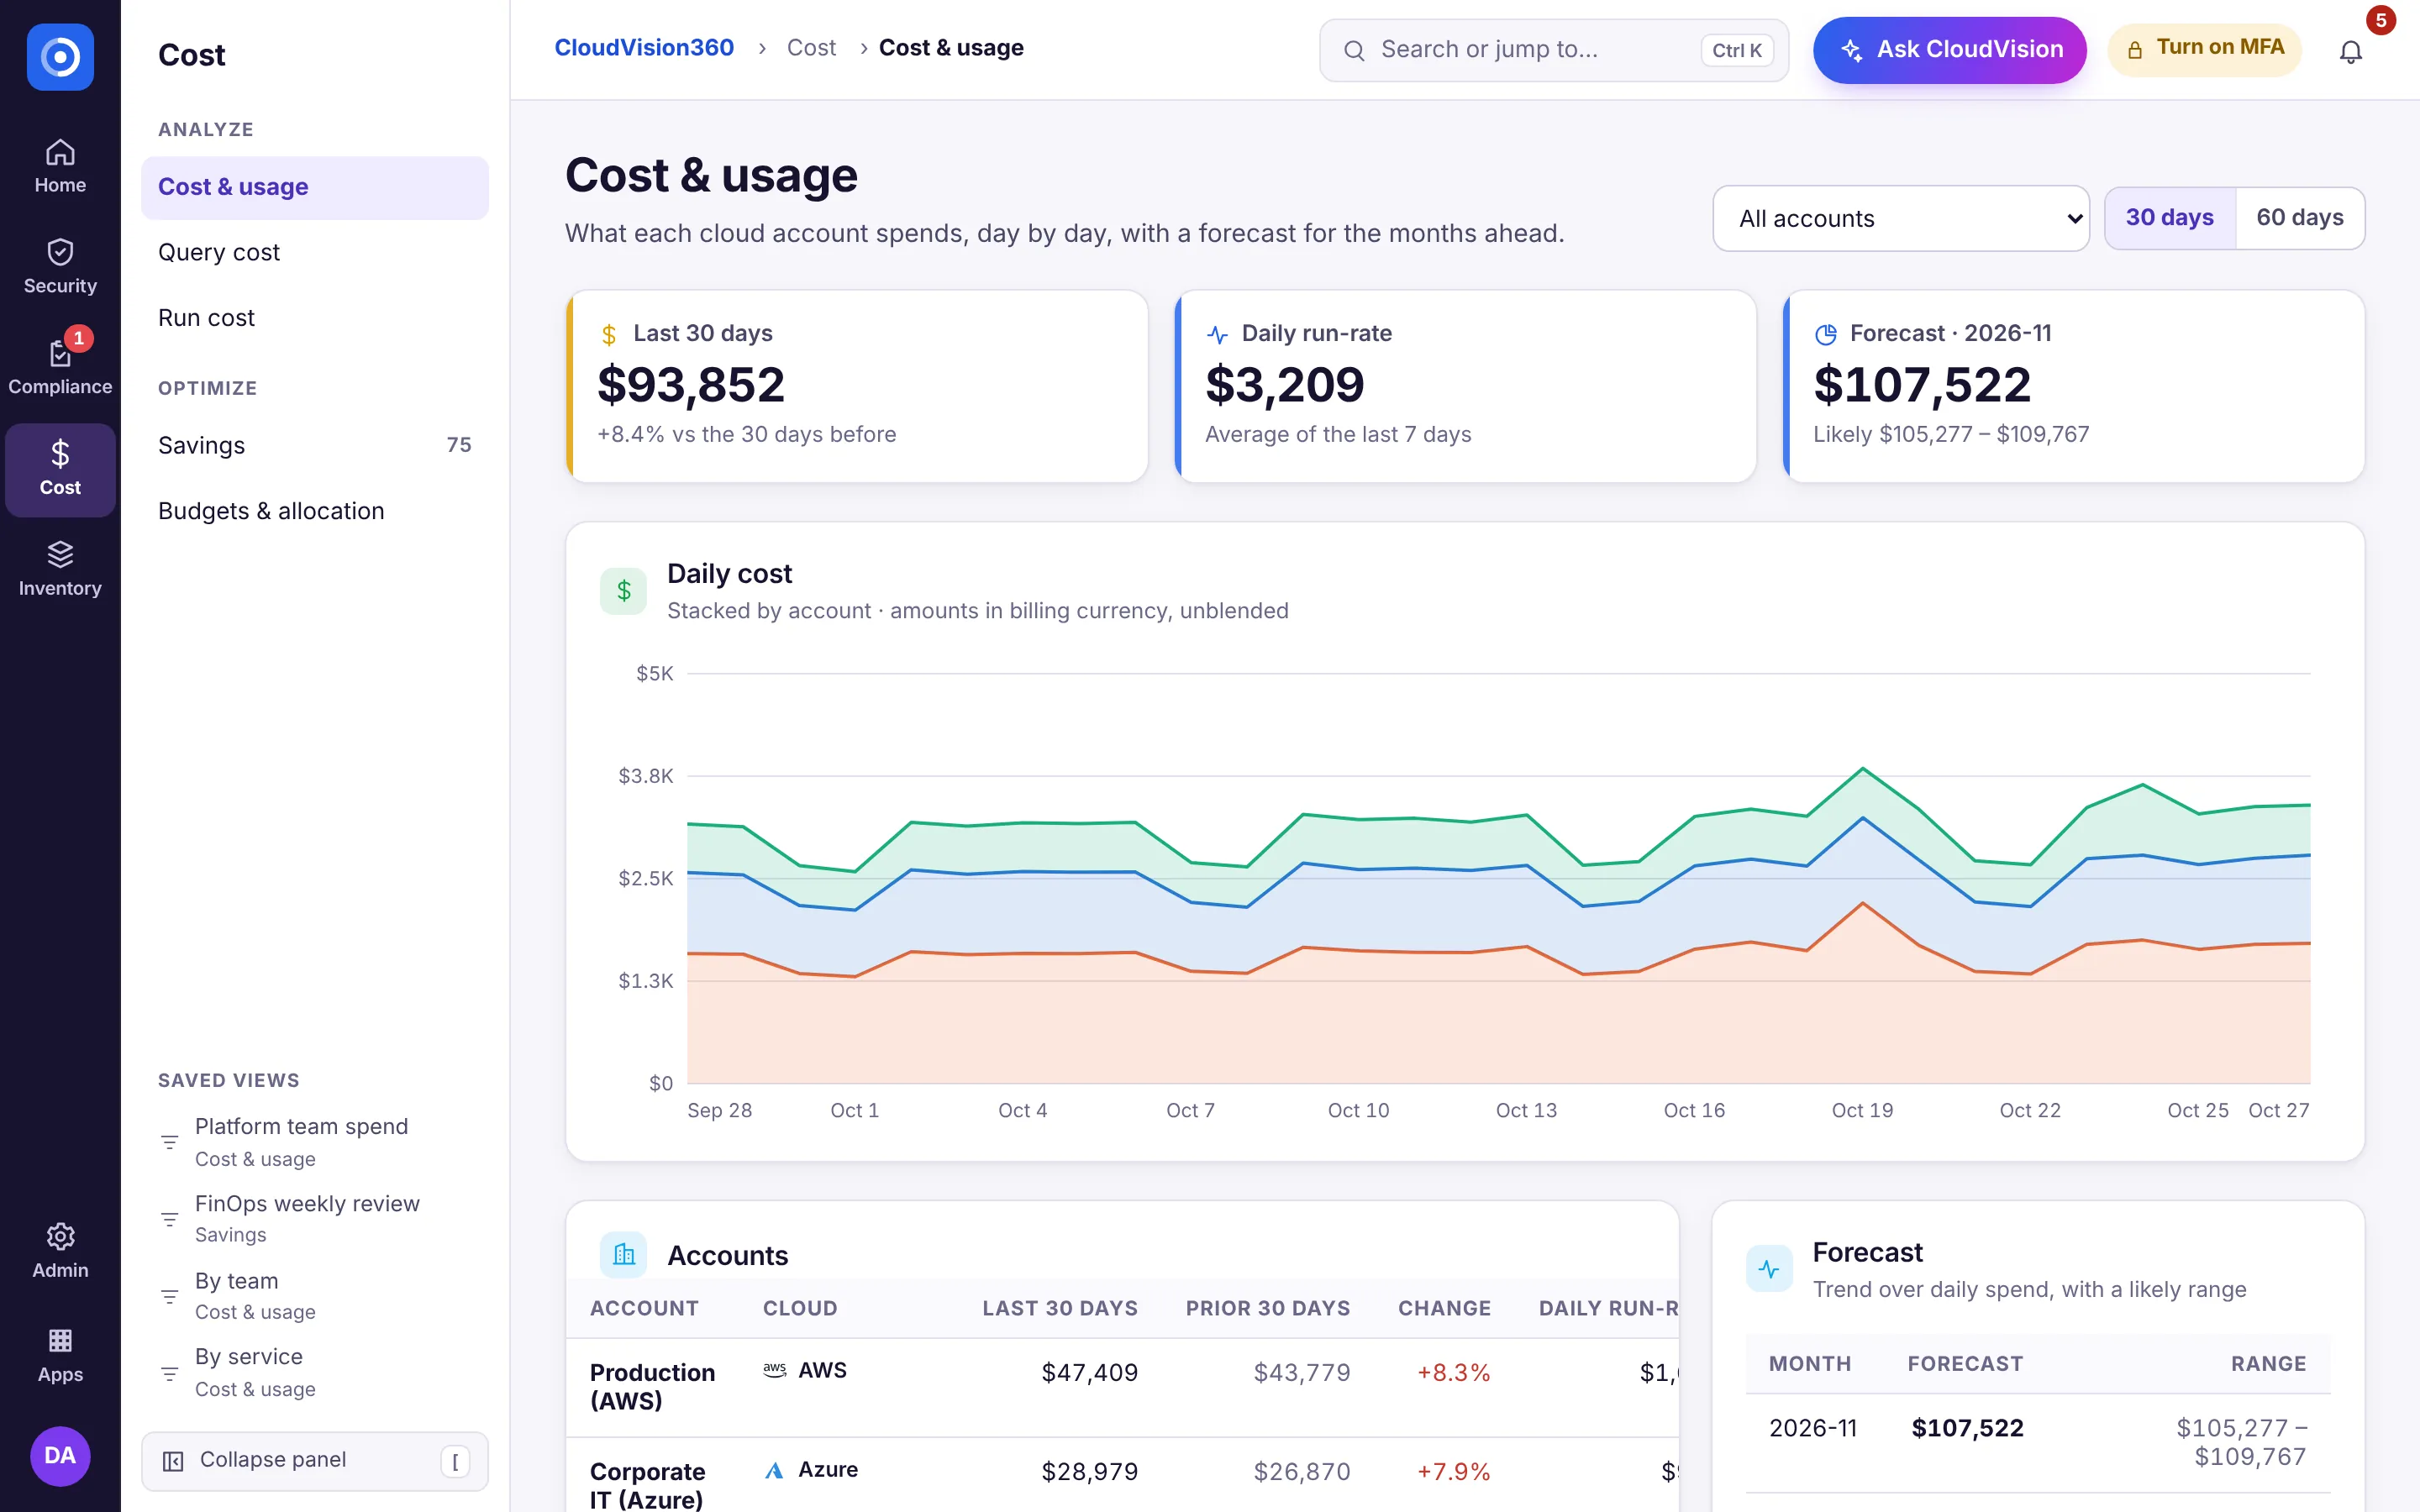
See up to 60 days of daily cost by service and account across Azure, AWS and GCP. Drill from a total into the services and accounts driving it. Cost data comes from each provider’s billing feed — Cost Management, Cost Explorer and the BigQuery billing export (see the connection guides).
Forecast
A month-end forecast projects where spend is heading at the recent pace, so a budget overrun is visible before the month closes rather than after.
Anomalies
When daily spend leaves its normal range (a 3σ threshold), it is flagged as an anomaly with the service and account behind it, so a runaway resource or a misconfigured job is caught early.
Cost and risk together
Because cost sits beside findings and inventory, a savings recommendation carries its security impact, and the Fix first list ranks by risk and cost at once.
Go deeper
For application-level cost — expensive queries, wasteful code and long-running pipelines — see query and application cost and pipeline, code and runtime review.