Dashboards and reporting
Executive, helpdesk and endpoint dashboards with published KPI definitions, plus a self-serve report builder.
Online version, always current: https://cloudvision360.com/docs/itops360/dashboards-and-reporting/
ITOps360 measures its own impact and lets you build the views your team and leadership need.
Dashboards
Everything here lives in the Insights hub of the icon rail: Executive, Helpdesk and Endpoints dashboards under Dashboards, and Reports and the Audit trail under Records. The dashboards come built in, with published KPI definitions so everyone agrees on what each number means. Metrics include tickets prevented, hours saved, automation success rate and CSAT.
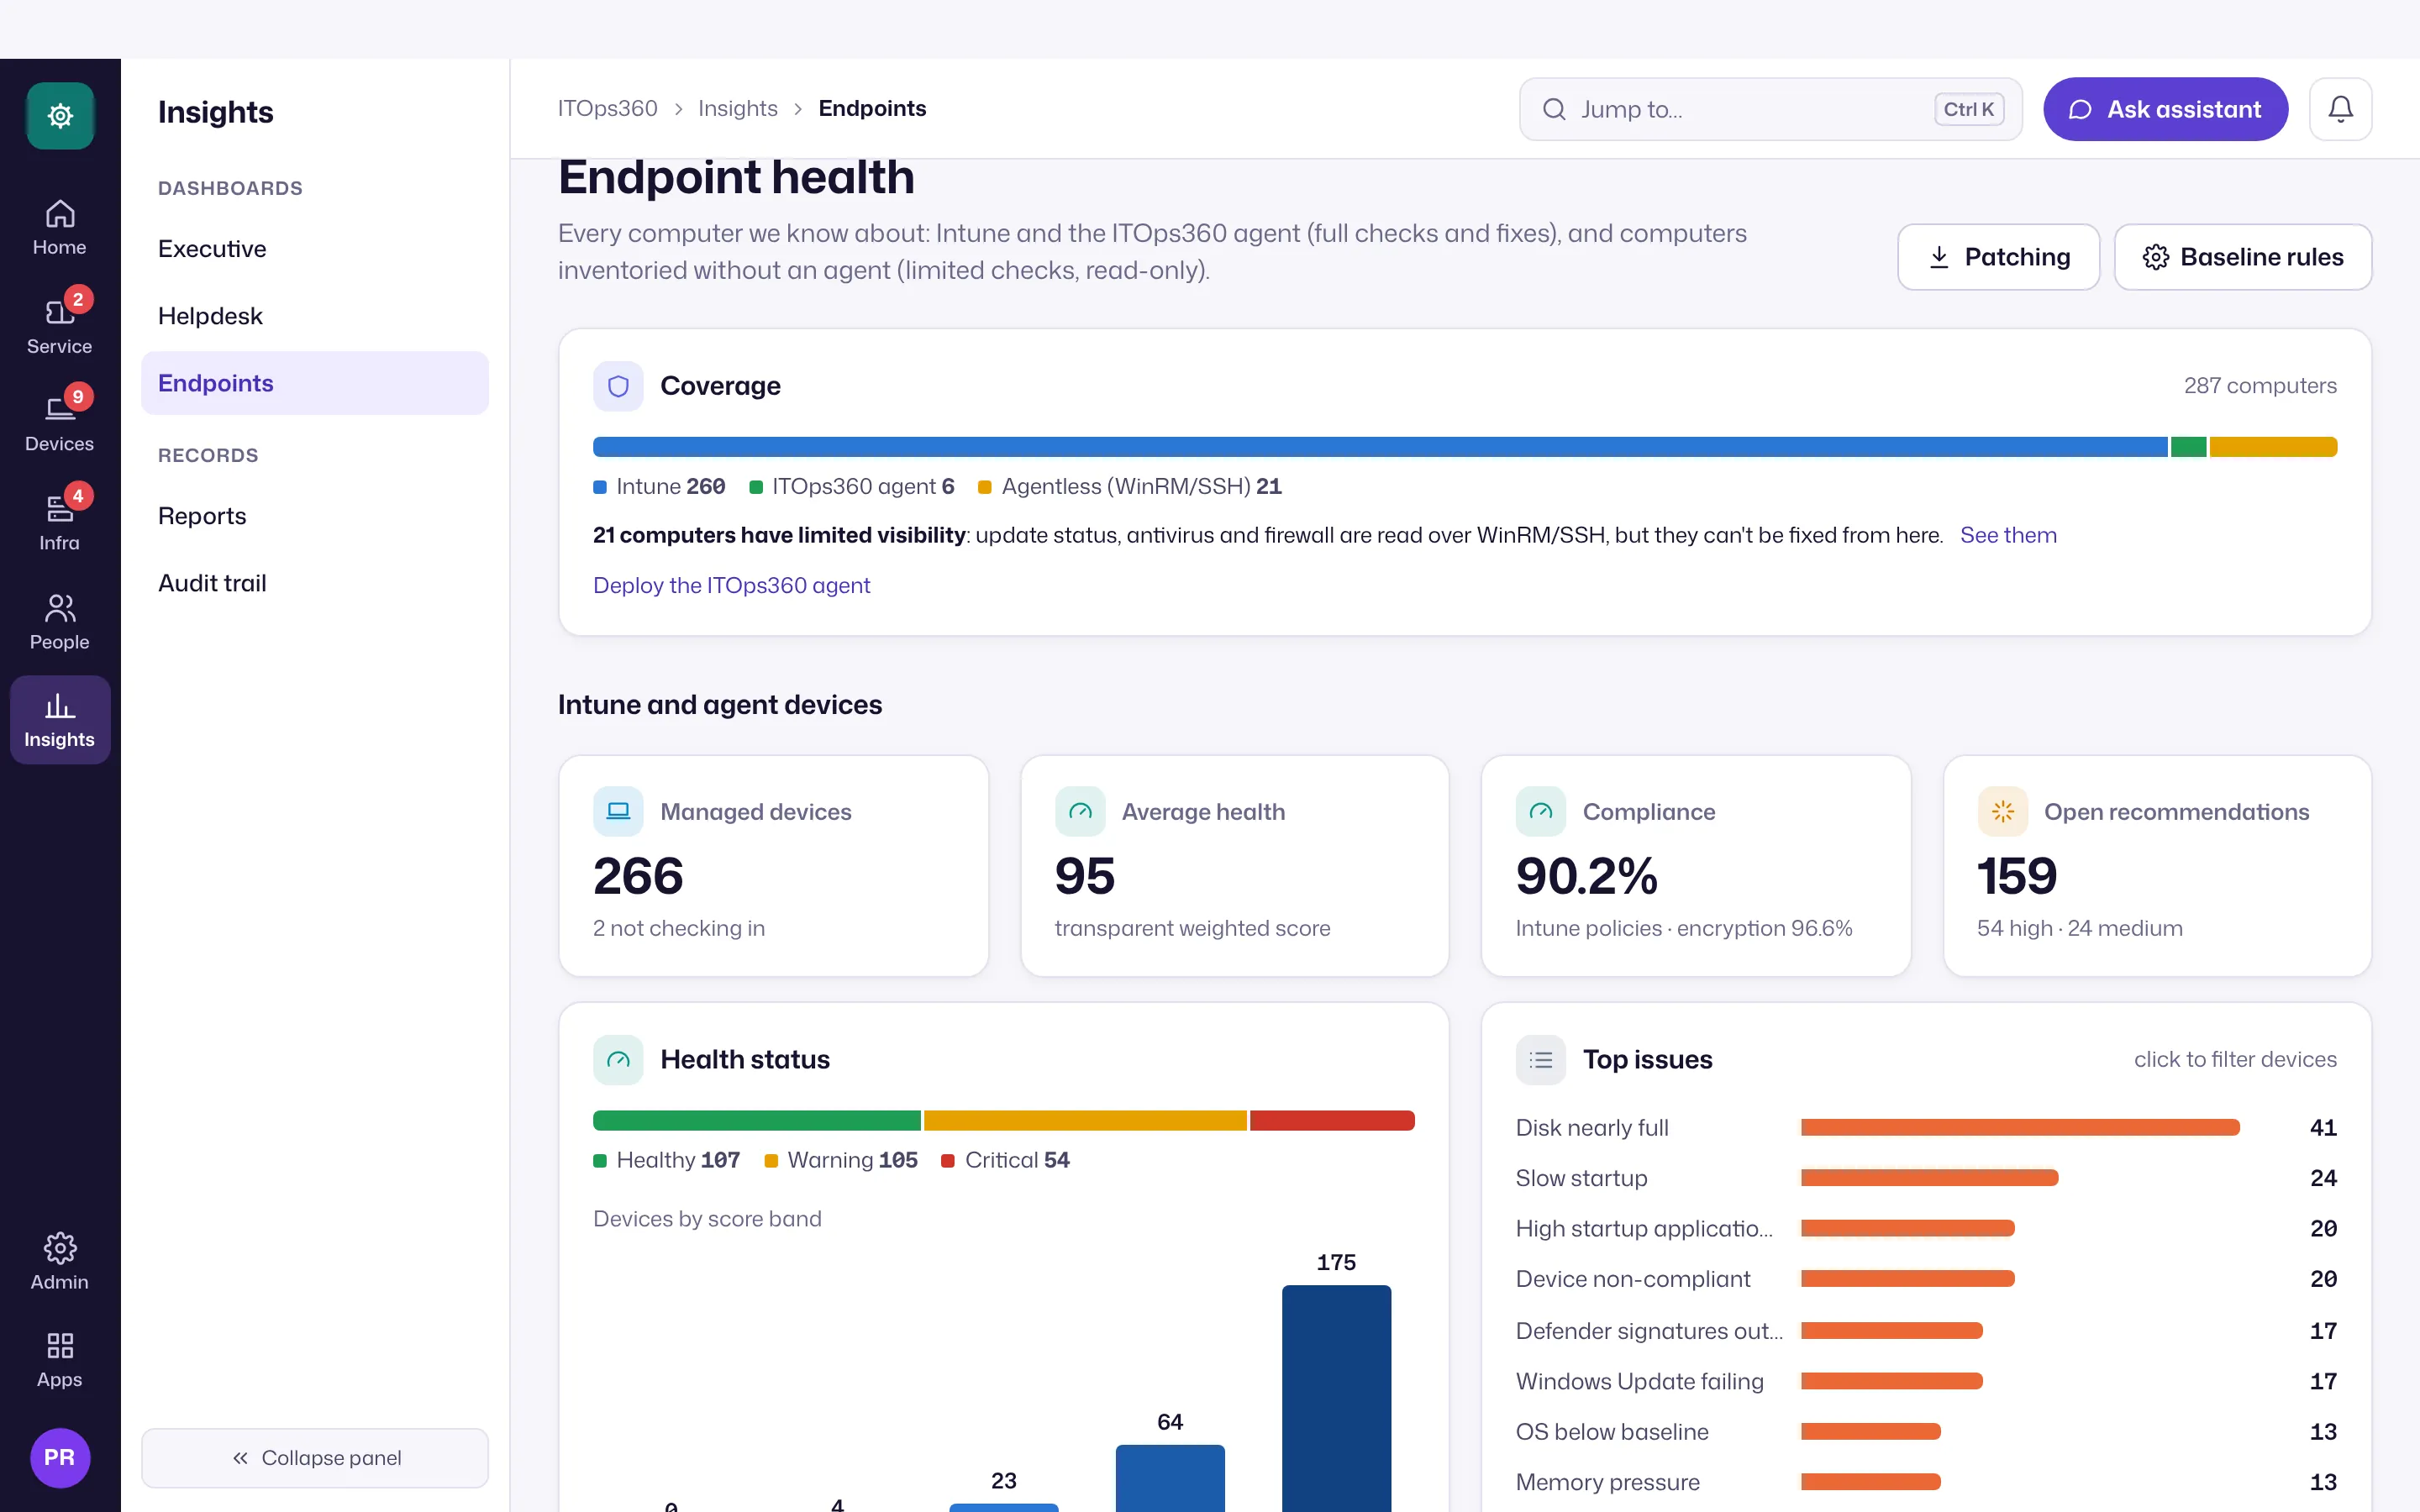
Want ITOps360 numbers next to cloud, AI and backup numbers? Build a custom dashboard in the portal: the ticket, SLA, workload, device and patch widgets come from ITOps360.
The report builder
Under Insights → Reports, a self-serve report builder lets you:
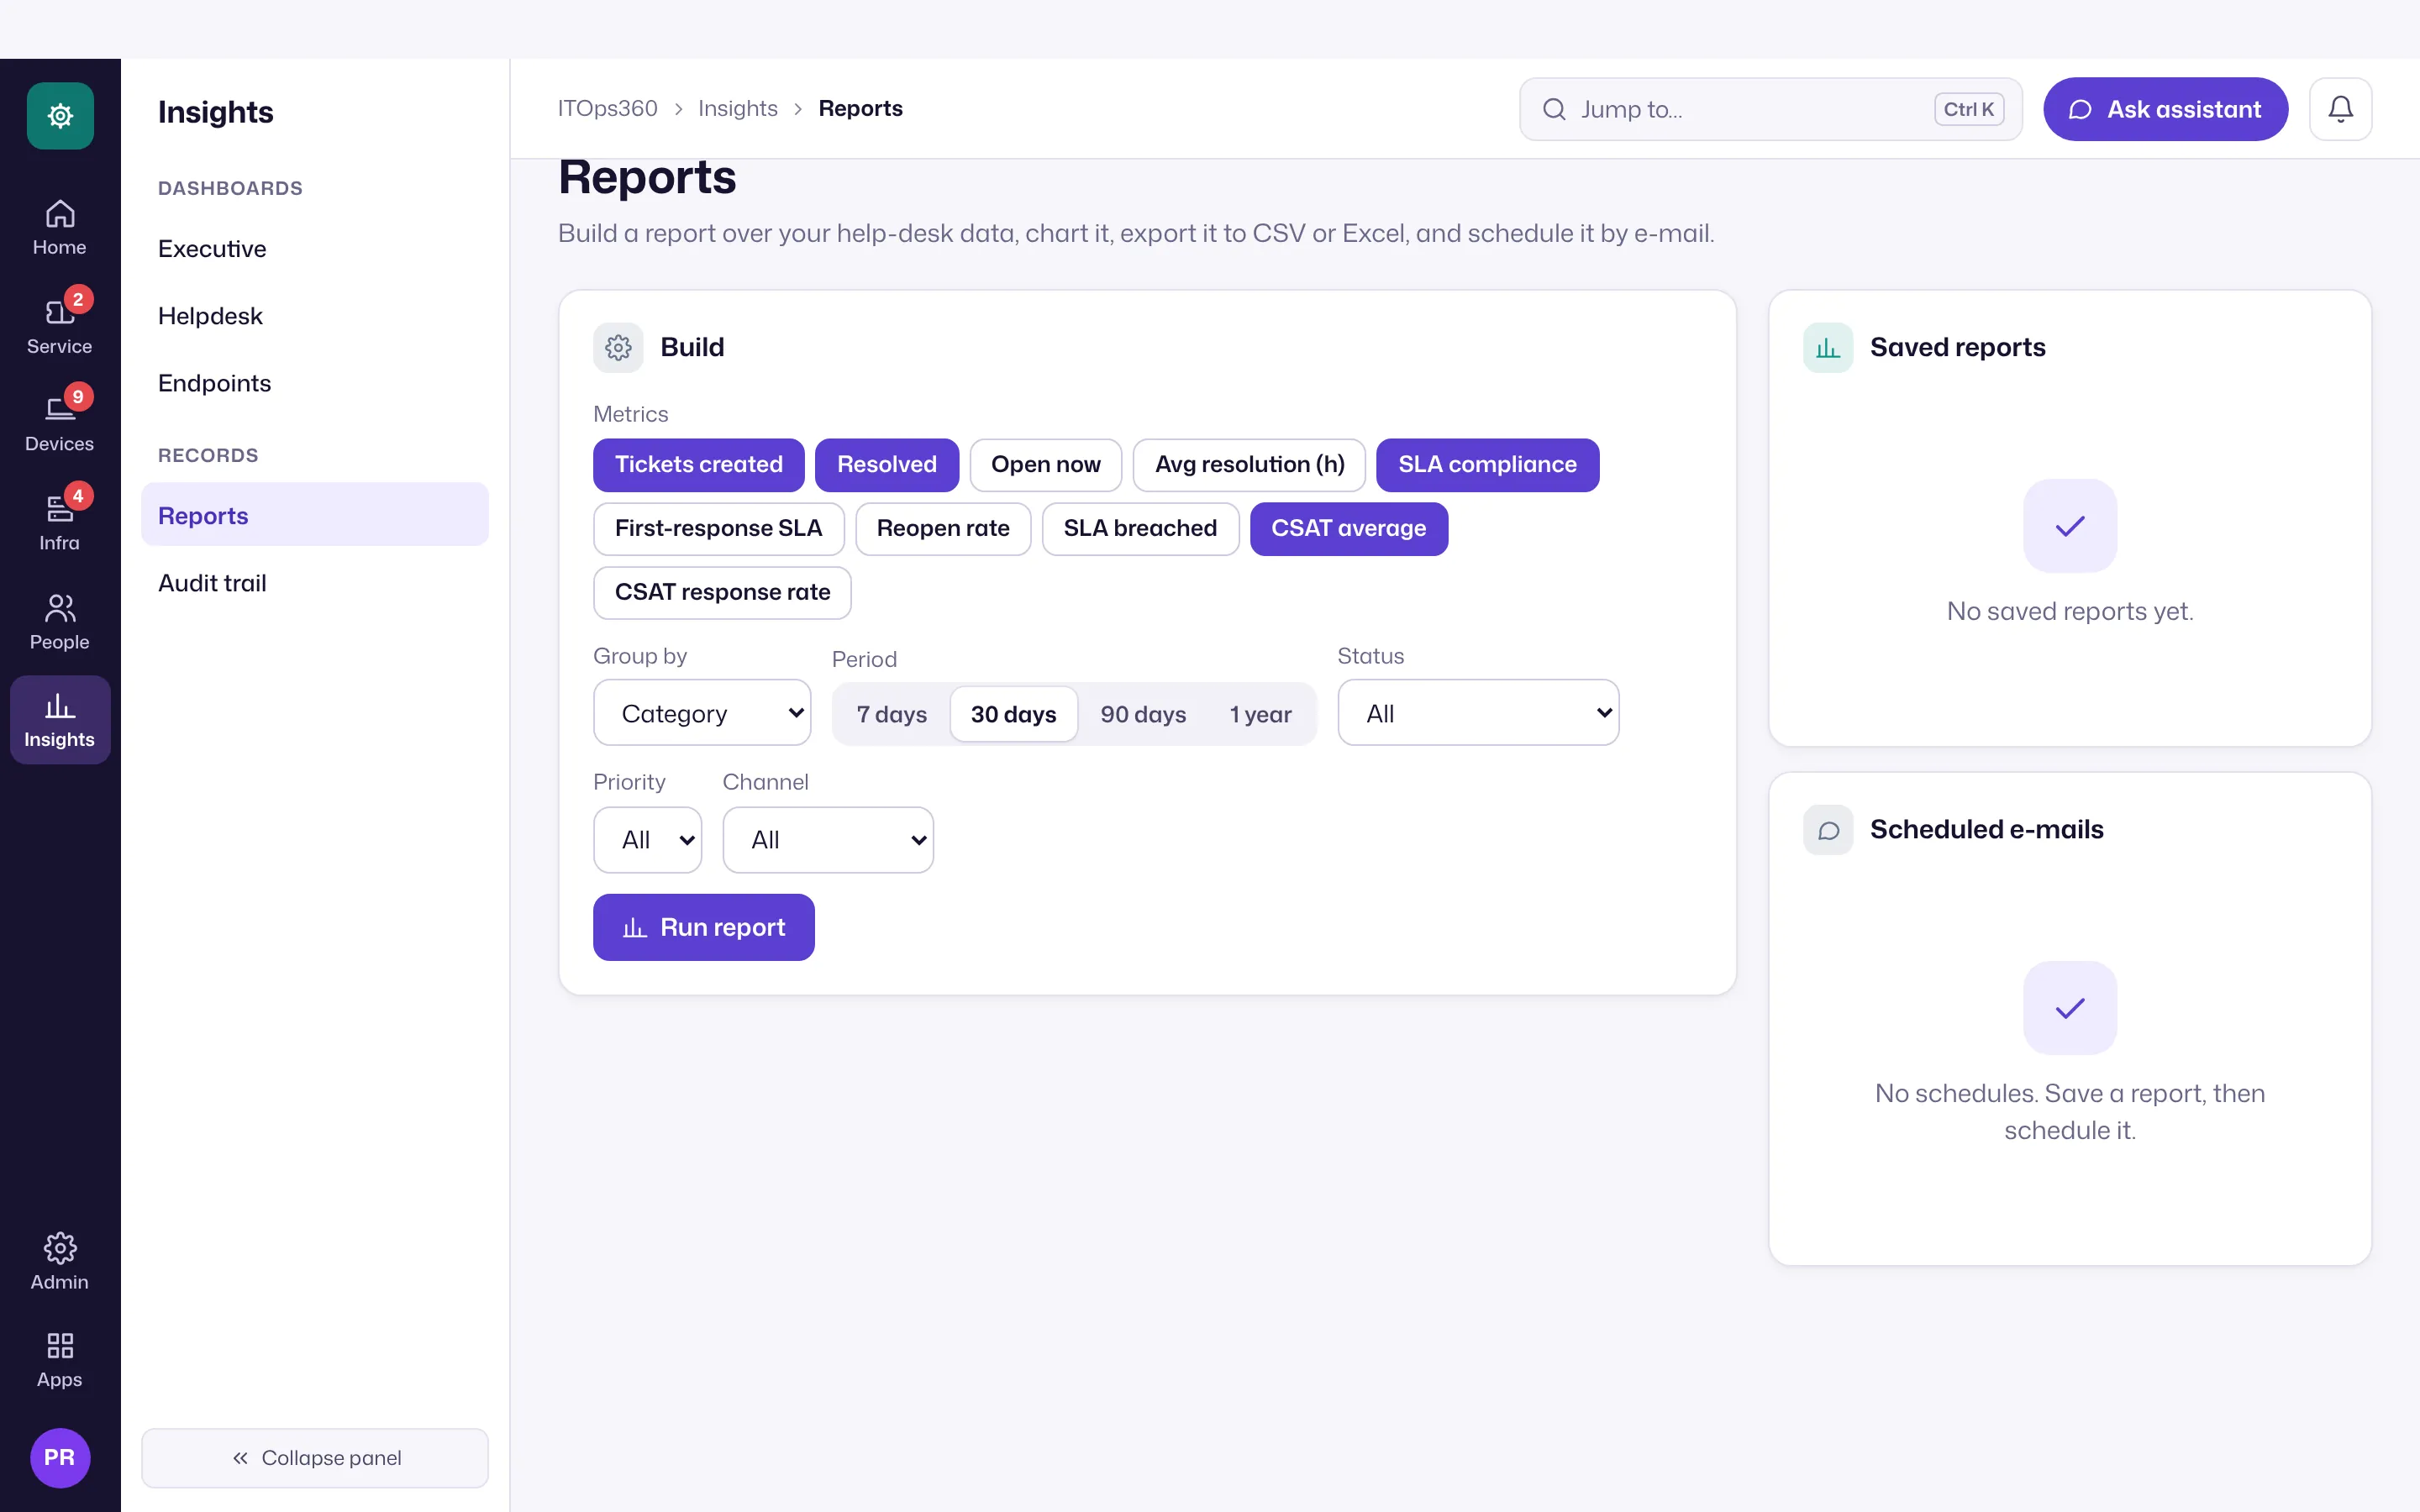
- Pick metrics, dimensions and filters.
- Save the view for reuse.
- Export to CSV or Excel.
- Schedule it by email.
So a weekly service report or a monthly endpoint summary goes out on its own.
Audit trail
Underneath it all is a hash-chained audit trail the database will not let anyone edit — the same tamper-evident record as the rest of the platform (see audit trail).
Notifications
Dashboards and reports pair with notifications to Teams, Slack, email and signed webhooks.